Smooth Route
Crowd sensing road quality for optimal bicycle routing
Interactive Demo
![]()
Smooth Route is a crowd-sensing solution to automatically analyse road quality and provide routing capabilities to cyclists. The Smooth Route sensing device is equipped with a 3-axis accelerometer capable of recording at 800Hz, a Nordic nRF51822 BLE SoC, an Ultra-Bright RGB LED and a Micro-USB rechargeable 100mAh Lithium ion polymer battery provides up to 3 weeks of battery life.
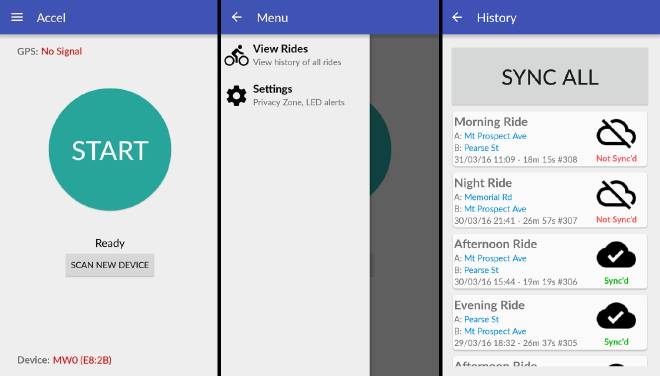
The sensor connects over Bluetooth Low Energy to mobile application that stores, processes and uploads ride information.
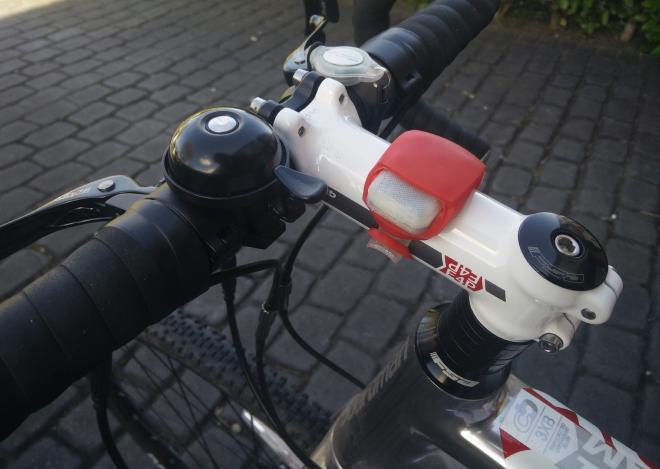
A custom 3D printed case is used to attach it to a bike. This can be seen and downloaded from Thingiverse.
This device can be easily used by simply tapping any NFC enabled smartphone off the device.
A beta program was run over 6 months using 10 participants to gather information. The data collected is processed and analysed in real-time to create an interactive map seen here. This included 520 roads, 300 rides and 2500km of cycling.
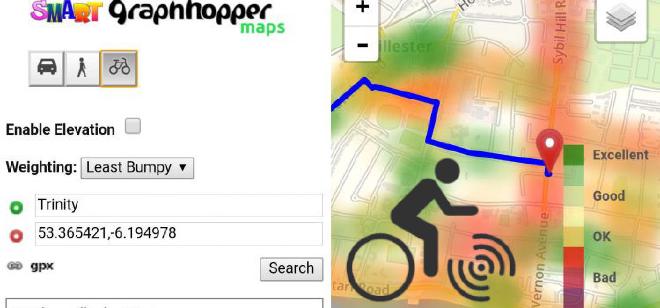
Smart-GH, which is based on the open source routing library GraphHopper, has been adapted to provide routing capabilities based on the smoothest route.
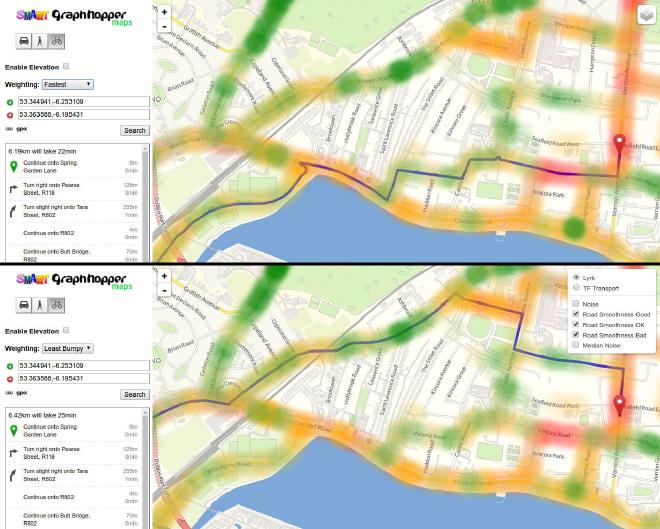
In the above example routing by “least bumpy” results in a slightly longer but smoother route. In reality, with this example, the speed gained by going on the smoother road would result in that route being quicker.
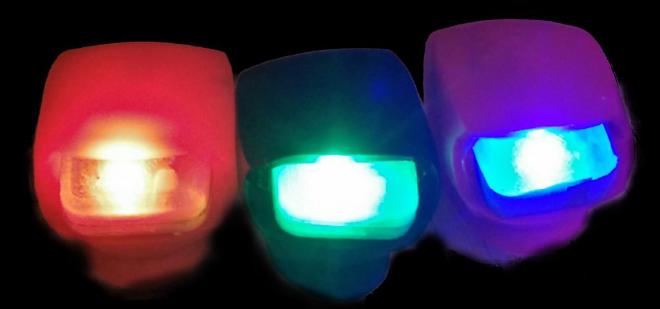
In addition to sensing road quality the Smooth Route device acts to mirror your mobile notifications in a similar way to the LED found on most Android phones. When you get a call or message while cycling the ultra-bright LED flashes different colors meaning you’ll never miss an important call or text while cycling.
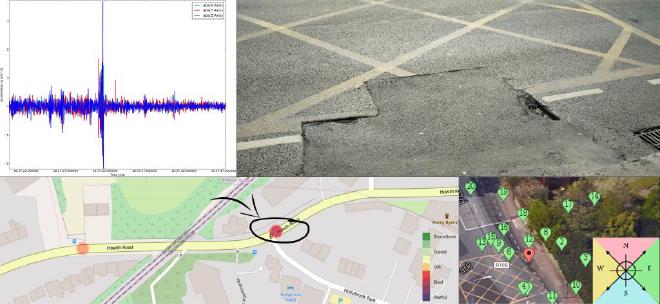
Potholes and other road anomalies are located and grouped. Below is an example of a hole across the full cycle lane. This particular hole is difficult to avoid due to alongside traffic and the placement of a traffic island forcing cars particularly close.
The bottom right image below shows the estimated location of the hole by Smooth Route represented by the red marker. The photograph reveals how close this is to the true location.
The green markers relate to individual readings of that bump, the green color shows that these are all travelling east indicating the side of the road.
The top left image shows the raw data recorded for one reading of that bump.
The bottom left image points to the location of the pothole on the interactive map.